In Matplotlib, the core idea of object-oriented programming is to create a figure object, and then call the figure object’s methods and properties to draw the image. In this process, the PyPlot library is responsible for generating a graphic object and adding one or more axes objects (i.e. drawing area) through the object. This article will tell you how to use the Matplotlib figure object with some examples.
1. How To Use Matplotlib Figure Object To Plot Graph.
- Matplotlib provides the matplotlib.figure graphic class module, which contains methods for creating graphic objects.
- You can call the python PyPlot module’s figure() method to create the figure object instance.
- Below is the steps about how to use the PyPlot module’s figure() method to plot graphs.
- Import the Matplotlib library pyplot module.
from matplotlib import pyplot as plt
- Call the PyPlot module’s figure() method to create a blank canvas.
figure_object = plt.figure()
- The figure() method contains the below arguments.
dgecolor : Border color.

dpi : Specifies the resolution of the drawing object, that is, how many pixels per inch. The default value is 80.

facecolor : Background color.

figsize : Specifies the size of the canvas (width, height), in inches.

frameon : Specify whether show the border or not.
- add_axes(): Add axes axis field to canvas. The parameter value of this method is a sequence. The four numbers in the sequence correspond to the left, bottom, width, and height of the graph respectively, and each number must be between 0 and 1.
ax = figure_object.add_axes([0, 0, 1, 1])
- Set the figure title as ‘cos wave’.
>>> ax.set_title("cos wave") Text(0.5, 1.0, 'cos wave') - Set the figure x label to ‘angle’.
>>> ax.set_xlabel("angle") Text(0.5, 0, 'angle') - Set the figure y label to ‘cos’.
>>> ax.set_ylabel("cos") Text(0, 0.5, 'cos') - Invoke the plot(x, y) method to plot the figure.
>>> ax.plot(x, y)
2. Matplotlib Figure Example.
- Below is the Matplotlib figure example source code.
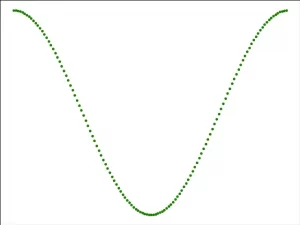
# import the matplotlib pyplot module.
from matplotlib import pyplot as plt

# import the numpy module.
import numpy as np

# import the math module.
import math

# generate the x axis value.
x = np.arange(0, math.pi*2, 0.05)

# caculate the y axis value with the numpy cos() method.
y = np.cos(x)

# call the PyPlot module's figure() method to create the Matplotlib figure object.
figure_object = plt.figure()

# create a canvas object in the figure object.
ax = figure_object.add_axes([0,0,1,1])

# plot the green dot cos curve.
ax_plot = ax.plot(x,y, 'g.')

print(ax_plot[0])

# display the figure.
plt.show()
- When you run the above example source code, you will get the below figure.