PyLab is a drawing library interface for Matplotlib, and its syntax is very similar to that of MATLAB. It can be used together with the PyPlot module to implement the drawing function of Matplotlib. PyLab is a separate module that is installed with the Matplotlib package.
1. How To Import PyLab & PyPlot.
- First, make sure you have installed the python Matplotlib library, please read the article How To Install Python Package Numpy, Pandas, Scipy, Matplotlib On Windows, Mac, And Linux.
- Then you can use the below python source code to import the PyLab & PyPlot modules.
# below code can import the Pyplot library.
from matplotlib import pytplot as plt
# you can use the below 2 way to import the PyLab library.
import pylab
# import all the sub classes in the pylab module.
from pylab import *
2. Draw Curve Examples With PyLab Plot Function.
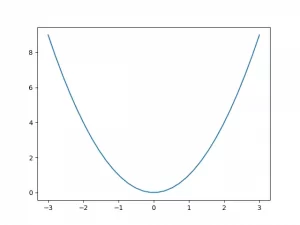
2.1 Draw Quadratic Curve.
- Below is the python source code.
>>> from pylab import * # import all the methods from the pylab library.
>>>
>>> x = linspace(-3, 3, 30) # calculate the x axis values.
>>>
>>> y = x**2 # the y axis value is x**2
>>>
>>> plot(x, y) # draw the quadratic curve.
[<matplotlib.lines.Line2D object at 0x000001E1C4A26A60>]
>>> show() # show the curve picture.
- Below is the quadratic curve graph.
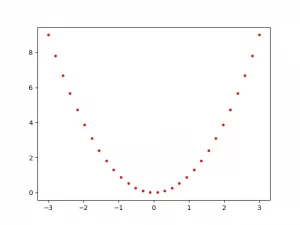
2.2 Draw Red Dot Quadratic Curve.
- Below is the python source code.
>>> from pylab import * # import the pylab library.
>>>
>>> x = linspace(-3, 3, 30) # calculate the x axis values
>>>
>>> y = x**2 # the y axis value is x**2
>>>
>>> plot(x, y, 'r.')  # r means red and . means dot line.
[<matplotlib.lines.Line2D object at 0x000001E1C9AFC220>]
>>> show()
- Below is the example graph.
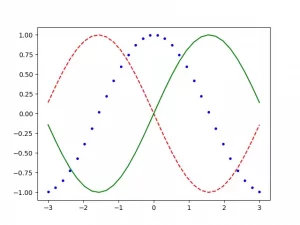
2.3 Draw Multiple Curves.
- Below is the example source code.
>>> from pylab import * # import the  pylab module.
>>>
>>> plot(x, cos(x), 'b.') # plot a blue cos curve use the dot line.
[<matplotlib.lines.Line2D object at 0x000001E1CE4392B0>]
>>>
>>> plot(x, -sin(x), 'r--') # plot a red -sin curve use two short line.
[<matplotlib.lines.Line2D object at 0x000001E1CE439730>]
>>>
>>> plot(x, sin(x), 'g-') # plot a green sin curve use single short line.
[<matplotlib.lines.Line2D object at 0x000001E1CE439AF0>]
>>>
>>> show() # show the multiple curve graph.
- Below is the above example generated graph.