In a function graph, sometimes the independent variable X and the dependent variable Y correspond exponentially, so the scale of the coordinate axis needs to be set to a logarithmic scale. This article will tell you how to implement it in Matplotlib by resetting the axis format with examples.
1. How To Set Matplotlib Axis Format.
- Matplotlib uses the xscale or yscale attribute of the axes object to format the axes.
# set the first axes y axis format to 'log'. axes_left.set_yscale('log') - You can use the axes object’s attribute spines ( a python dictionary object ) to set the figure’s border’s style such as color, linewidth, etc.
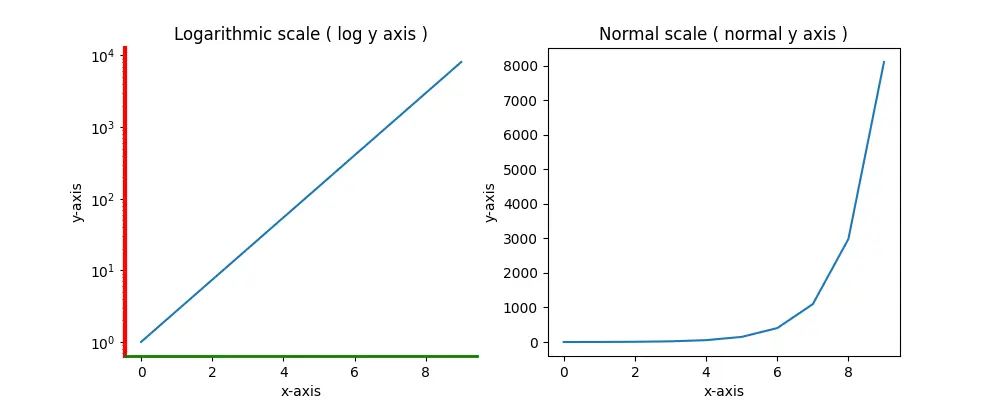
# set the y-axis color and line width. axes_left.spines['left'].set_color('red') axes_left.spines['left'].set_linewidth(3) - In the below example, there are 2 figures. The left figure’s axis has been modified, and the right figure’s axis is normal.
import matplotlib.pyplot as plt import numpy as np def matplotlib_set_axis_format(): # divide the figure canvas to 1 row and 2 columns. fig, axes = plt.subplots(1, 2, figsize=(10,4)) # get the first axes object. axes_left = axes[0] # get the second axes object. axes_right = axes[1] # calculate x array. x = np.arange(0, 10) # calculate the y values. y = np.exp(x) axes_left.set_title('Logarithmic scale ( log y axis )') axes_left.set_xlabel('x-axis') axes_left.set_ylabel('y-axis') # set the first axes y axis format to 'log'. axes_left.set_yscale('log') # set the y-axis color and line width. axes_left.spines['left'].set_color('red') axes_left.spines['left'].set_linewidth(3) # set the x-axis color and line width. axes_left.spines['bottom'].set_color('green') axes_left.spines['bottom'].set_linewidth(2) # hide the right and top border. axes_left.spines['right'].set_color(None) axes_left.spines['top'].set_color(None) # call the plot function to draw the figure. axes_left.plot(x,y) axes_right.set_title('Normal scale ( normal y axis )') axes_right.set_xlabel('x-axis') axes_right.set_ylabel('y-axis') axes_right.plot(x,y) # show the figure. plt.show() if __name__ == '__main__': matplotlib_set_axis_format() - When you run the above example, it will create the below picture.