When drawing with Matplotlib, in most cases, we need to divide a canvas into several sub-areas, and then we can draw different graphics on these areas. In this section, we will learn how to draw multiple subgraphs on the same canvas.
1. Matplotlib subplot() Function.
- The matplotlib.pyplot module provides a subplot() function, which can divide the canvas equally. The parameter format of this function is as follows.
plt.subplot(nrows, ncols, index)

nrows, ncols: Denotes the number of rows and columns to be divided into subregions (nrows*nclos denotes the number of subgraphs).

index: The initial value is 1, which is used to select a specific sub region.
- For example, the subplot(3, 6, 9) will divide the current canvas into 3 rows and 6 columns, at the same time, select the 9th sub-area to draw the subgraph.
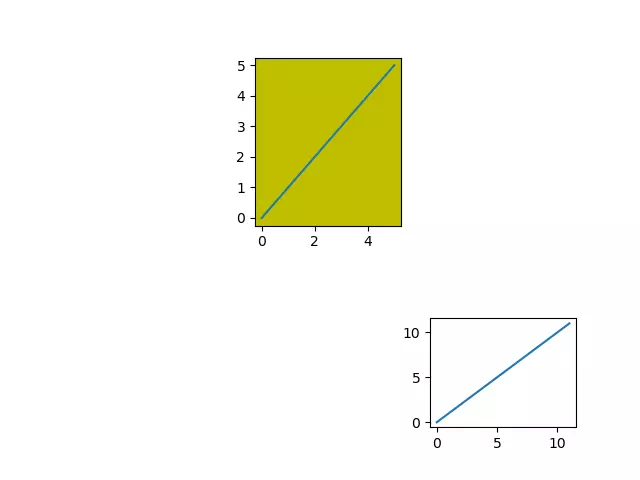
- Below is an example, it will divide the current canvas twice.
- The first time it will divide the current canvas into 3 rows and 3 columns and draw a figure on the 9th sub-area.
- The second time it will divide the current canvas into 2 rows and 3 columns and draw a figure on the second sub-area.
- The 2 figures will override each other because they are on different sub-areas of the current canvas.
- Below is the source code.
# import the matplotlib.pyplot module. import matplotlib.pyplot as plt def subplot_example(): # divide the current canvas into 3 rows and 3 columns, and draw the figure on the 9the sub area. plt.subplot(3, 3, 9) # plot the below figure on the 9th sub area. plt.plot(range(12)) # divide the current canvas into 2 rows and 3 columns, and draw the figure on the second sub area. plt.subplot(232, facecolor='y') # plot the below figure on the second sub area. plt.plot(range(6)) # the above 2 figures will not override each other, because they are on different sub area of the same canvas. # show the above 2 figures. plt.show() if __name__ == '__main__': subplot_example() - When you run the above example source code, you will get the below figure.
2. Matplotlib subplots() Function.
- The matplotlib.pyplot module provides a subplots() function, which is similar to the subplot() function.
- The difference is that subplots() create both a canvas containing subgraph areas and a figure graphic object, while subplot() only creates a canvas containing subgraph areas.
2.1 Syntax Of subplots() Function.
- (fig , ax) = plt.subplots(nrows, ncols): nrows and ncols represent two integer parameters, which specify the number of rows and columns occupied by the subgraph.
- The return value of the function is a tuple, including a graphic object and all axes objects.
- The number of axes objects is equal to nrows * ncols, and each axes object can be accessed through the index value (starting from 1).
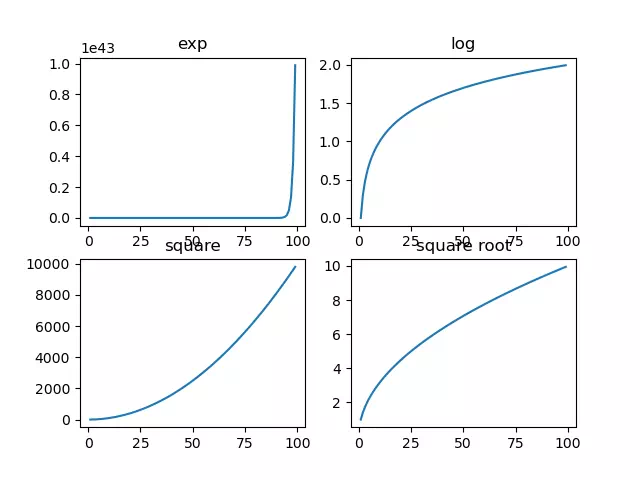
2.2 Matplotlib subplots() Example.
- Next, we create a subgraph with 2 rows and 2 columns and display 4 different images in each subgraph.
- Below is the example source code.
# import the matplotlib.pyplot module. import matplotlib.pyplot as plt # import the numpy module. import numpy as np def subplots_example(): # invoke the subplots function to create 4 axes objects and a figure object. (fig,a) = plt.subplots(2,2) # create an array that contain number 1 to 100. x = np.arange(1,100) # draw exponential function image. a[0][0].plot(x,np.exp(x)) a[0][0].set_title('exp') # draw logarithmic function image. a[0][1].plot(x,np.log10(x)) a[0][1].set_title('log') # draw square function image. a[1][0].plot(x,x*x) a[1][0].set_title('square') # draw square root function image. a[1][1].plot(x,np.sqrt(x)) a[1][1].set_title('square root') plt.show() if __name__ == '__main__': subplots_example() - When you run the above example source code, you will get the below figure.