This article shows you how to insert another plot into the same figure canvas by adding axes objects to the figure, then you can plot multiple plots on the same figure using Python Matplotlib.
1. Matplotlib Plot Multiple Plots On Same Figure Steps.
- Import Matplotlib pyplot module.
import matplotlib.pyplot as plt
- Call plt.figure() function to get a Figure object.
figure_object = plt.figure()
- Call the above Figure object’s add_axes([left, bottom, width, height]) to create axes.
# the input parameter is the created axes object's dimensions array [left, bottom, width, height].
# the number in the array are all relative to the figure canvas.
# for example, 0.1 means 10 percent to the figure left, 0.2 means 20 percent to the figure bottom, 0.5 means 50 percent of the figure width and height size.
axes_1 = figure_object.add_axes([0.1, 0.1, 0.5, 0.5])
- You can call the add_axes() function multiple times to add multiple axes. And you should set the axes coordinates carefully in the input array to avoid overlapping.
- Then you can call the axes object’s plot method to plot multiple plots in it’s own axes.
axes_1.plot(x, y_1, 'g')
2. Matplotlib Plot Multiple Plots On Same Figure Examples.
- Below is the example source code.
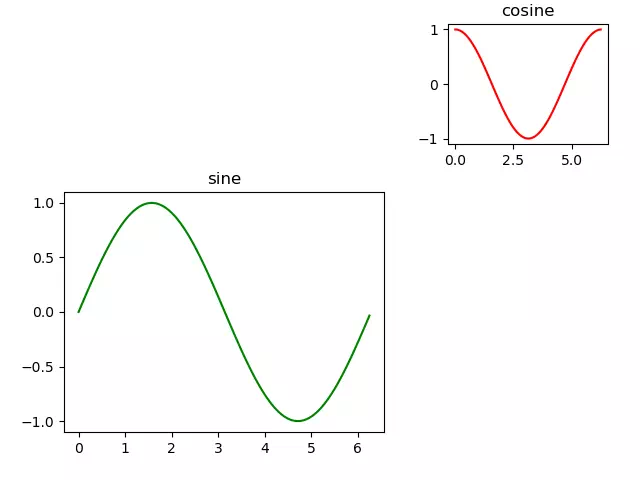
import matplotlib.pyplot as plt import math import numpy as np def plot_multiple_plots_on_saem_figure_canvas(): # create the x-axis value array. x = np.arange(0, math.pi*2, 0.05) print('x = ', x) # call the matplotlib.pyplot module's figure() method to create a Figure object. figure_object = plt.figure() # call the figure object's add_axes method to add a axes. # the input parameter is the created axes object's dimensions array [left, bottom, width, height]. # the number in the array are all relative to the figure canvas. # for example, 0.1 means 10 percent to the figure left, 0.2 means 20 percent to the figure bottom, 0.8 means 80 percent of the figure width and height value. axes_1 = figure_object.add_axes([0.1, 0.1, 0.5, 0.5]) #axes2 = fig.add_axes([0.55, 0.55, 0.3, 0.3]) # create another axes object, you should set the axes coordinates carefully in the input array to avoid overlapping. axes_2 = figure_object.add_axes([0.7, 0.7, 0.25, 0.25]) # calculate the first y-axis's value with the numpy module sin() method. y_1 = np.sin(x) # calculate the second y-axis's value with the numpy module cos() method. y_2 = np.cos(x) # set the first axes's title. axes_1.set_title('sine') # plot the first axes use the green color. axes_1.plot(x, y_1, 'g') # set the second axes's title. axes_2.set_title("cosine") # plot the second axes use the red color. axes_2.plot(x, y_2,'r') # show the figure canvas. plt.show() if __name__ == '__main__': plot_multiple_plots_on_saem_figure_canvas() - When you run the above example code, you will get the below figure.