The matplotlib.pyplot module provides the function subplot2grid(), which creates axes objects ( plot areas ) at specific locations on the canvas. Not only that, but it can also use a different number of rows and columns to create drawing areas with different spans. Unlike the subplot() and subplots() functions, the subplot2gird() function splits the canvas in a non-equal way and displays the final plot result according to the size of the plot area.
1. The Syntax Of Function subplot2grid().
- The subplot2grid() function syntax is plt.subplot2grid(shape, location, rowspan, colspan), below is the input parameters introduction.
- shape: The grid region specified by this parameter value is used as the drawing region.
- location: Draw the graph at the given location, the initial position (0,0) representing row 1, column 1.
- rowsapan/colspan: These two parameters are used to set how many rows and columns the subarea spans.
2. Function subplot2grid() Example.
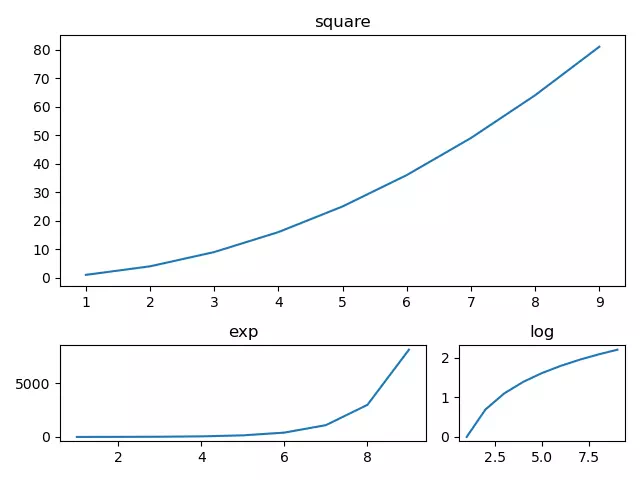
- This example adds subareas with different row and column spans to the canvas (figure), and then draws different shapes on each sub-drawing area, below is the example source code.
# import the matplotlib.pyplot module. import matplotlib.pyplot as plt import numpy as np def subplot2grid_example(): # create 3 sub areas, the parent area has been divided into 3 rows and 3 columns. # create the first sub area that span 2 rows and 3 columns, it is located at the (0,0) which means the first row and first column. a1 = plt.subplot2grid((3,3),(0,0),colspan = 3, rowspan = 2) # create the second sub area that span 1 row and 2 columns, it is located at the (2, 0) which means the third row and first column. a2 = plt.subplot2grid((3,3),(2,0), rowspan = 1, colspan = 2) # create the third sub area that span 1 row and 1 column, it is located at the (2,2) which means the third row and third column. a3 = plt.subplot2grid((3,3),(2,2),rowspan = 1, colspan = 1) # create a number array. x = np.arange(1,10) print(x) # plot the square curve on the first sub area. a1.plot(x, x*x) a1.set_title('square') # plot the exp curve on the second sub area. a2.set_title('exp') a2.plot(x, np.exp(x)) # plot the log curve on the second sub area. a3.plot(x, np.log(x)) a3.set_title('log') # adjust the sub plots paddings. plt.tight_layout() plt.show() if __name__ == '__main__': subplot2grid_example() - When you run the above source code, you can get the below picture.