The grid() method provided by the Matplotlib axes object can turn on (show) or off (hide) the grid in the canvas and the primary/secondary scale of the grid. In addition, the grid() function can also set the color, line type, line weight, and other properties of the grid. This article will show you an example of it.
1. Syntax Of The grid() Function.
- Below is an example of using the grid(color, ls, lw) function, it shows the grid(color, ls, lw) function’s syntax.
grid(color='g', ls = '-', lw = 0.35)

color: set the color of the grid line.

ls: set the style of the grid line.

lw: set the width of the grid line.
- The grid is turned off by default. By calling the above function, the grid will be turned on automatically.
- If you want to turn on the grid without any style, you can do it by calling the function grid(True), if you want to turn off the grid explicitly, you can call the function grid(False).
2. Matplotlib grid() Function Example.
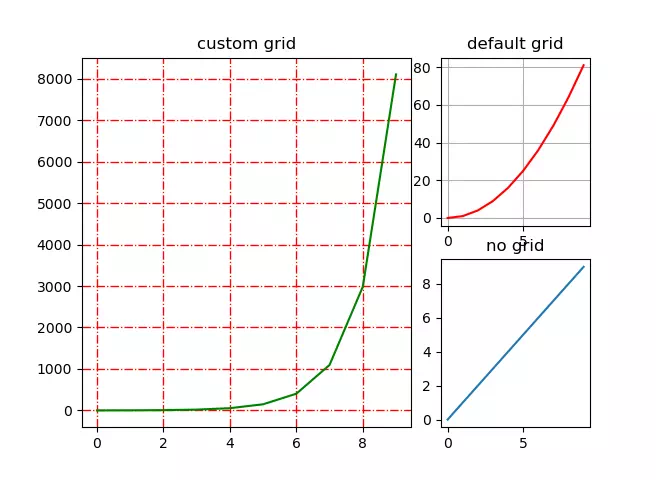
- This example contains 3 figures.
- The first figure uses a customized grid(the color is red, the line style is ‘-.’, the line width is 0.95).
- The second figure uses a default grid.
- The third figure turns off the grid.
- Below is the example full source code.
import matplotlib.pyplot as plt import numpy as np def matplotlib_grid_example(): # create the integer number array. x = np.arange(0,10) # the canvas will be divided to 2 rows and 3 columns. # create the first axes object located at (0,0)(first row, first column), it will span 2 rows and 2 columns. a1 = plt.subplot2grid((2,3),(0,0),colspan = 2, rowspan = 2) # set the plot title. a1.set_title('custom grid') # set the grid style. a1.grid(color='r', ls = '-.', lw = 0.95) # plot the curve with green color. a1.plot(x, np.exp(x), 'g') # create the second axes object located at (0,2)(first row, third column), it will not span any rows and columns. a2 = plt.subplot2grid((2,3),(0,2)) # set the plot title. a2.set_title('default grid') # set the default grid style. a2.grid(True) # plot the curve with red color. a2.plot(x, x*x, 'r') # create the third axes object located at (1,2)(second row, third column), it will not use any grid. a3 = plt.subplot2grid((2,3),(1,2)) a3.set_title('no grid') a3.grid(False) a3.plot(x,x) plt.show() if __name__ == '__main__': matplotlib_grid_example() - Below is the above example generated figure when you run it.