The scale refers to the marking of data points on the axis, and Matplotlib automatically plots the scale on the x and y axes. This functionality is made possible by Matplotlib’s built-in calibration locator and formator (two built-in classes).
In most cases, these two built-in classes are perfectly adequate for our drawing needs, However, in some cases, the scale labels or scales need to meet specific requirements, such as setting the scale to “English numerals” or “Uppercase Arabic numerals”, and they need to be reset.
1. How To Set The Matplotlib Plot Scale & Scale Label.
- The set_xticks() and set_yticks() functions take a list object as an argument, and the elements in the list represent the scale to be displayed on the corresponding axis.
- For example ax.set_xticks([2,4,6,8,10]) will set the x-axis scale with the marks 2,4,6,8,10.
- You can also set the scale labels corresponding to the scale lines using the set_xticklabels() and set_yticklabels() functions respectively.
- Below is the example source code.
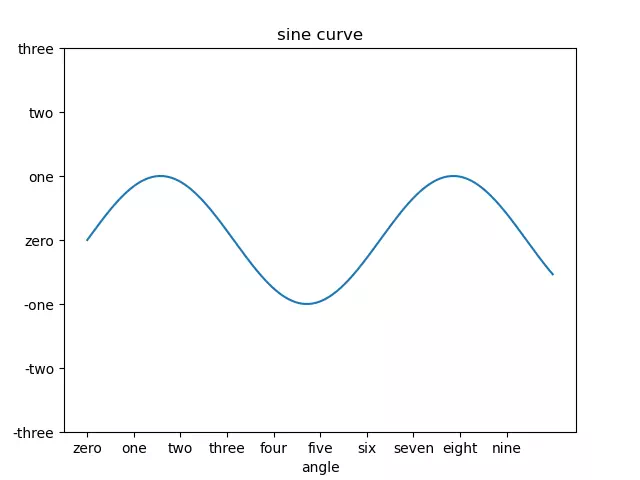
import matplotlib.pyplot as plt import numpy as np def set_matplotlib_scale_and_label_example(): # create the x-axis value array. x_value = np.arange(0, 10, 0.01) # calculate the y-axis value array. y_value = np.sin(x_value) # create the figure object. fig = plt.figure() # add the drawing area. ax = fig.add_axes([0.1, 0.1, 0.8, 0.8]) # plot the sine curve figure. ax.plot(x_value, y_value) # set the curve figure title. ax.set_title('sine curve') # set the x-axis label. ax.set_xlabel('angle') # set the x-axis scale value. ax.set_xticks([0,1,2,3,4,5,6,7,8,9]) # set the x-axis scale label. ax.set_xticklabels(['zero','one','two','three','four','five','six','seven','eight','nine']) # set the y-axis scale value. ax.set_yticks([-3, -2, -1, 0, 1, 2, 3]) # set the y-axis scale label. ax.set_yticklabels(['-three', '-two', '-one', 'zero', 'one', 'two', 'three']) # show the plot. plt.show() if __name__ == '__main__': set_matplotlib_scale_and_label_example() - Below is the figure that the above source code generated.