In this article, you will learn how to use Matplotlib to plot a simple sine curve that shows the relationship between the angle and the value of the sine function.
1. How To Draw A Simple Sine Curve Using Python Matplotlib Steps.
- First, import the Pyplot module in the Matplotlib package, and simplify the name of the imported package in the form of as alias.
import matplotlib.pyplot as plt
- Next, use the function arange() provided by NumPy to create a set of data to draw the image.
# import numpy library.
import numpy as np

# get the ndarray object between 0 and 2π.
x = np.arange(0, math.pi*2, 0.05)
- The value of X obtained above is the value on the X-axis, and the sinusoidal value corresponding to this value, that is, the Y-axis value is obtained by the following method.
y = np.sin(x)
- Use the plot() function to plot the sine curve with the x and y value.
plt.plot(x,y)
- The main drawing work has been completed, but we still need to draw some details, which need to be supplemented, such as x-axis and y-axis labels, image titles, etc.
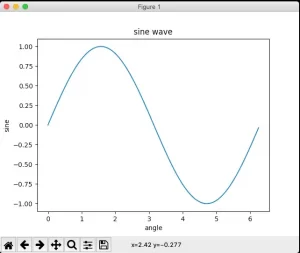
# plot the x, y label. plt.xlabel("angle") plt.ylabel("sine") # plot the image title. plt.title('sine wave') - The complete example program code is as follows.
# import matplotlib pyplot module. from matplotlib import pyplot as plt # import numpy module. import numpy as np # import python math module. import math # call the math.pi method to convert radians to angles. # get the x-axis value. x = np.arange(0, math.pi*2, 0.05) # calculate the y-axis value use the np.sin() method. y = np.sin(x) # plot the sine curve. plt.plot(x,y) # draw the x-axis and y-axis label. plt.xlabel("angle") plt.ylabel("sine") # draw the image title. plt.title('sine wave') # call the show() method to display the image. plt.show() - When you run the above example source code, you will get the below sine curve image.
References
