When you use matplotlib.pyplot module’s subplot() method to plot multiple figures, you may find the figures may overlap each other. This article will tell you how to fix the issue.
1. How To Avoid Overlapping Subplots Figures.
- In the above example, the 2 figures will not override each other. This is because the 2 figures are drawn on the different sub-area of the current canvas.
- But if you draw the 2 figures in the same sub-area of the current canvas, then they will override each other. This section will tell you how to avoid this scenario.
- First, let’s look at the below example.
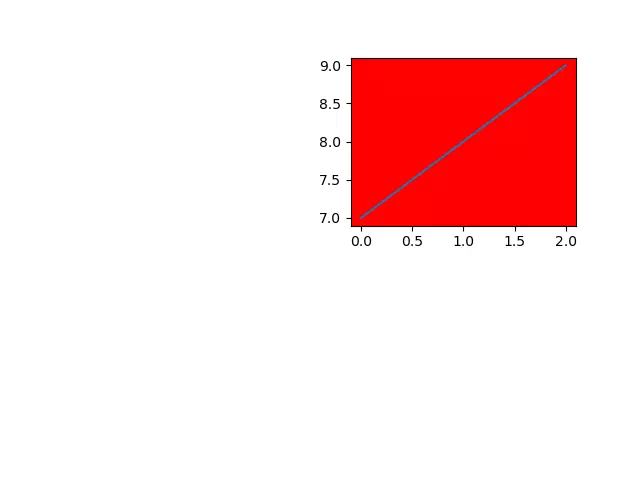
# import the matplotlib.pyplot module. import matplotlib.pyplot as plt def add_subplot_function_example(): # divied the canvas to a 1 row 1 column subarea, and draw a figure on the first subarea with the green color. plt.subplot(1,1,1, facecolor='green') # plot a line. plt.plot([1,2,3]) # divide the canvas to a 2 rows 2 columns subarea, and draw the figure on the second subarea with the red color. plt.subplot(2,2,2, facecolor='red') # plot the second figure, you will find that it will override the first figure. plt.plot([7,8,9]) # show the canvas. plt.show() if __name__ == '__main__': add_subplot_function_example() - When you run the above example, you will get the below picture, you will find that the second figure will override the first figure.
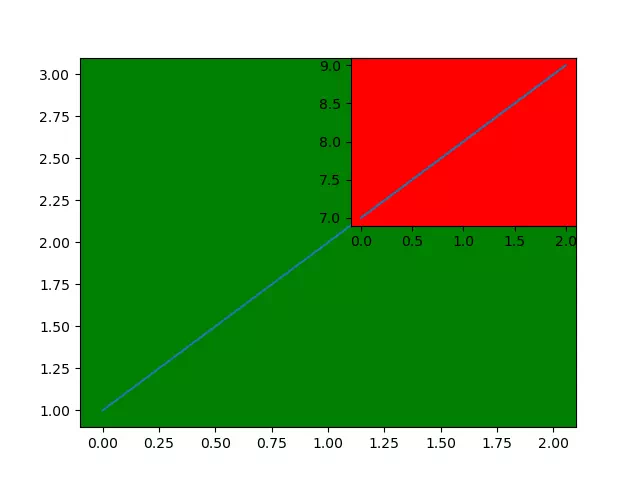
- To avoid this case, we can call the matplotlib.pyplot module’s figure() method to create a figure object, then call the figure object’s add_subplot() method to add a subplot on the current canvas. This can avoid the figures being overlapped.
# import the matplotlib.pyplot module. import matplotlib.pyplot as plt def add_subplot_function_example(): # call the pyplot module's figure() method to create a figure object. fig = plt.figure() # call the figure object's add_subplot() method to divide the current canvas. ax1 = fig.add_subplot(1, 1, 1, facecolor='green') # plot a figure with the green color. ax1.plot([1,2,3]) # add another subplot, this figure will not override the first figure. ax2 = fig.add_subplot(2, 2, 2, facecolor='red') # plot the second figure. ax2.plot([7,8,9]) plt.show() if __name__ == '__main__': add_subplot_function_example() - Now you can find the second figure will not override the first figure when you run the above source code.